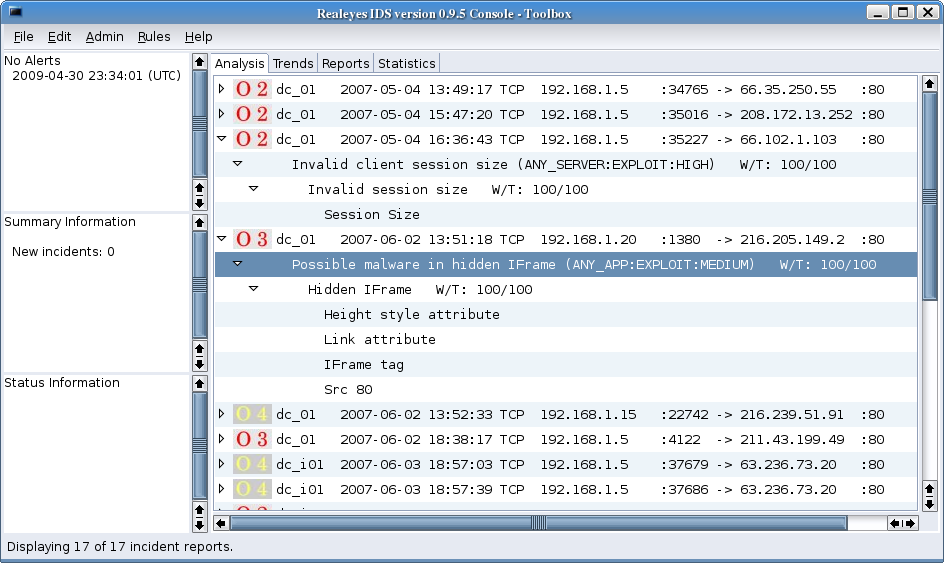

| When an incident is displayed in the Analysis tab, the session information is displayed on a single line. This information includes the sensor reporting it, the timestamp of the start of the session, and the addresses of the session. The icon at the front of the incident indicates whether it is Open, Reported, or Ignored (closed without a report), and the highest severity of the Events reported. By clicking on the 'twisty' at the left of the line, the Events detected for that incident are displayed. Likewise, if the 'twisty' for an Event is clicked, the Actions defining it are displayed. And if the 'twisty' for an Action is clicked, the Triggers defining it are displayed. Typically, there are several Triggers but only one or two Actions. |